
Global LNG Market on Brink of Oversupply

Alexey BELOGORIEVDirector of Research, Institute of Energy and Finance Foundation
E-mail: [email protected]
Liquefied natural gas (hereinafter referred to as LNG) plays an increasingly important role in international trade in natural gas, determining its physical and price dynamics. For many large gas-consuming countries (all countries in South and East Asia except China; many countries in Latin America and Southeast Asia), LNG is the only source of import, which makes the physical and price availability of liquefied gas an important factor in the dynamics of gas demand both at the regional and global levels.
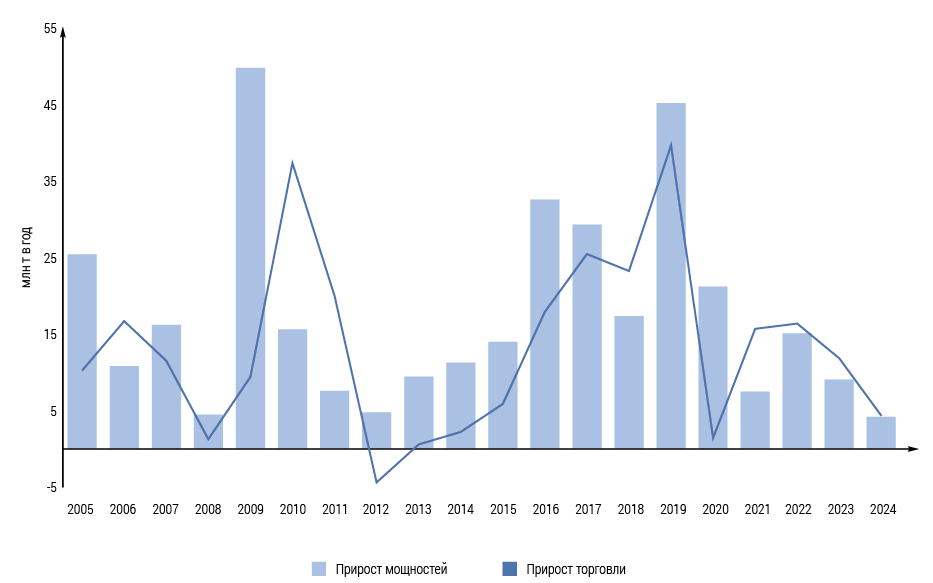
In 2024, the growth of international LNG trade slowed sharply to +1.1% y/y, according to GIIGNL , compared to an average annual growth of 4.1% in 2021–2023. Total trade volumes reached 405.8 million tonnes, or about 551 billion m3 in pipeline gas equivalent, corresponding to 13.1% of global gas consumption, according to IEA estimates. For comparison, LNG accounted for 12.2% of global gas consumption in 2021. LNG and natural gas demand grew at roughly the same rate between 2000 and 2018, but these dynamics began to diverge in 2019, with LNG consumption growing by 12% in 2019 and natural gas consumption by only 1.7%. Since then, LNG consumption has been growing faster than overall gas demand on average. In the period 2025–2040, the share of LNG in both consumption and international gas trade is expected to increase. The slowdown in 2024 reflects the wave-like nature of the global LNG market development, which is based on a certain cyclicality of investments in new gas liquefaction capacities and, as a result, an uneven schedule of their commissioning. This cyclical unevenness leads to a sharp increase in the commissioning of new liquefaction capacities (as was the case, for example, in 2016–2019), then to periods of slowdown, almost stagnation (as, in particular, happened in 2023–2024). The construction timeframes for new liquefaction capacities from the moment the final investment decision is made until commissioning are on average 4–6 years. With such long construction times, the schedule for commissioning new capacities inevitably diverges from the dynamics of demand for LNG, which is itself very volatile and sometimes difficult to predict. Over the past 15 years, there have been at least three cases where demand dynamics have not met long-term expectations: the stagnation of 2011–2015, caused by a combination of factors (the shale revolution in the US, declining gas demand in Europe, weak demand in Asia); the stagnation of 2020 due to the COVID-19 pandemic;
a sharp increase in demand in 2021–2024 due to the EU's switch from importing Russian pipeline gas to importing LNG, which led to an unprecedented increase in spot prices and a drop in both the price and physical availability of LNG. At the same time, a shortage of LNG supply began to be felt already in 2021 due to accelerated (above expectations) growth in demand in China, Europe, Brazil and other markets, with insufficient increase in supply.
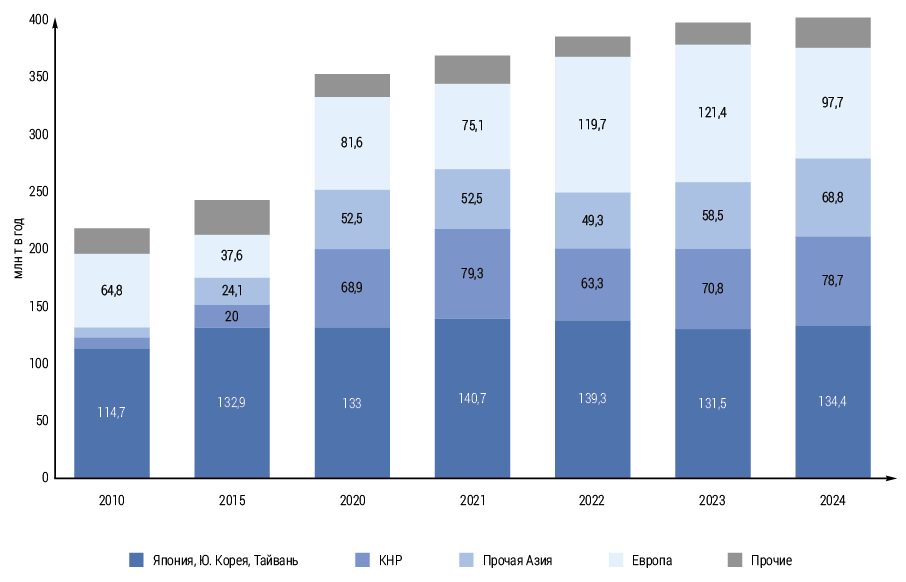
The very nature of the global LNG market has changed dramatically over the past 15 years. The number of LNG importing countries has increased from 23 in 2010 to 49 in 2024, and LNG has transformed from a commodity available mainly to the richest countries into a relatively “democratic” energy source, imported on a regular basis even by countries with lower-middle incomes (India, Pakistan, Bangladesh, the Philippines, Vietnam, etc.). The market volume has grown by 84% compared to 2010. China’s share in global imports has grown from 4.3 to 19.4%, while Japan’s share, on the contrary, has halved – from 32.2 to 16.3%. The importance of spot and short-term trade has increased sharply – its share has increased from 18.9% in 2010 to 36% in 2024, with spot now accounting for 30% of all trade. The average terms of long-term contracts and the share of contracts with fixed delivery points have decreased. A significant portion of contracts, especially in Europe, have switched from oil indexation to linking to exchange indicators (TTF, Henry Hub). Finally, we can talk about the merger of individual regional markets into a common global LNG market, which is expressed in the possibility of promptly redirecting supplies from one market to another and interregional price arbitrage. As a result, the LNG market has become more complexly organized, flexible and diversified, and at the same time more sensitive to price changes due to the noted increase in the share of imports from countries with lower-middle incomes.
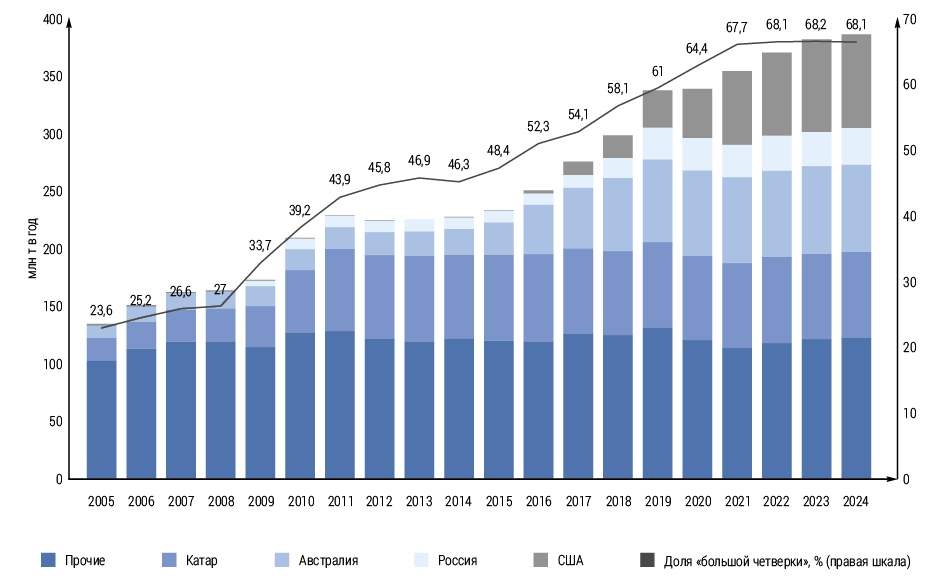
The supply of LNG also became less concentrated and more competitive back in the 2010s. This is facilitated not only by the increase in the number of market participants and the increased flexibility of contractual terms, but also by the opportunity for many exporting countries to flexibly and quickly redistribute exports between regional markets (USA, Qatar, Russian Arctic projects, etc.).
A number of leading pipeline gas exporters are also major LNG suppliers: Qatar, the United States, Russia, Indonesia, Algeria and Norway. Other pipeline gas supplier countries, including Canada, Mexico and, under favorable conditions, Iran, also plan to begin LNG exports in the 2020s. However, for many exporters, liquefied gas supplies are the only option due to their island nature, remoteness of sales markets or underdevelopment of the gas transportation system (Australia, Trinidad and Tobago, Oman, Brunei, Peru, etc.). The sharp and unexpected increase in LNG demand from the EU starting in 2022 has become a painful test of the market's adaptability. On the one hand, this test was passed successfully: in 2022, LNG supplies to Europe were increased by 59% y/y at once, and they became the second most important factor (after the reduction in overall gas demand) that made it possible to balance the EU gas market in extremely difficult conditions. On the other hand, the price for this was the formation of unsatisfied demand and, in fact, a hidden supply deficit, which led to an increase in prices and a drop in global gas consumption in 2022–2023. Only in 2024, against the backdrop of falling prices, was global consumption able to exceed 2021 levels and return to sustainable growth.
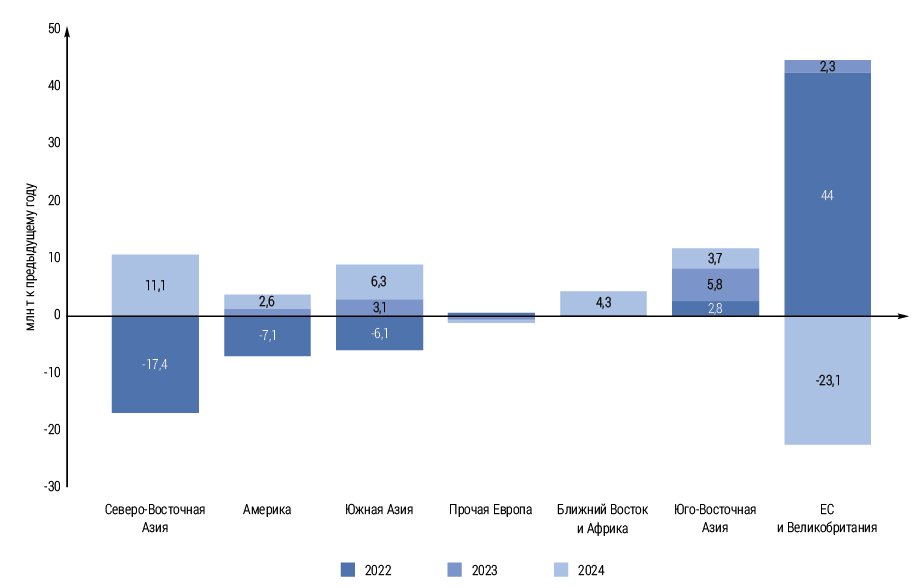
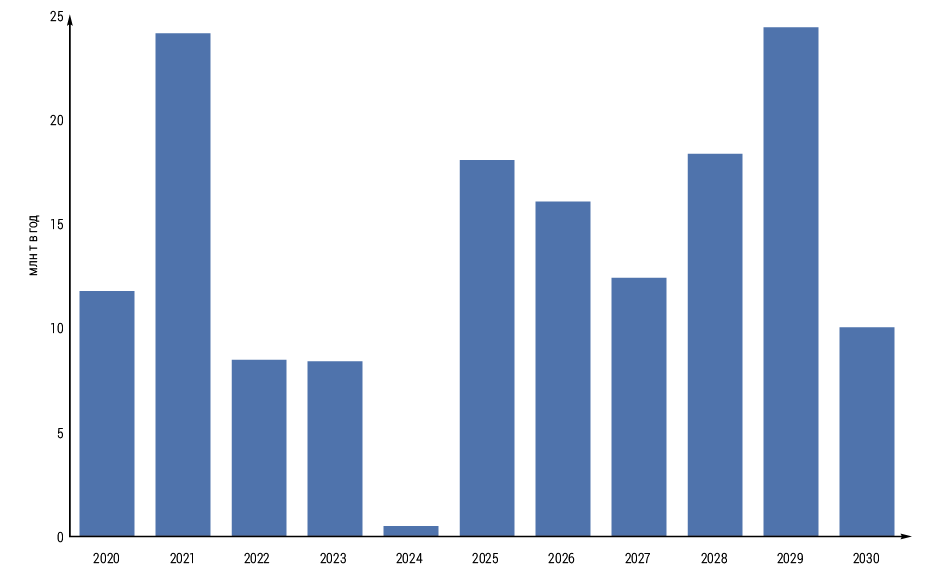
In terms of balancing the international LNG trade, 2022–2025 resembles a tug-of-war game: in 2022–2023, demand growth in Europe was made possible by a reduction in demand from Asian consumers. In 2024, on the contrary, Europe was forced to sharply reduce LNG imports to balance its recovery in Asia. In 2025, the situation will again become a mirror image: almost the entire expected increase in supplies (+20-22 million tons/year) will be absorbed by the European market, which needs to replenish depleted reserves in underground gas storage facilities and compensate for the loss of Ukrainian transit of Russian pipeline gas, while imports from Asia, on the contrary, will stagnate after growing by 7% in 2024 due to a combination of a high accumulated base, relatively warm weather in the first quarter and an increase in average annual spot prices. The slowdown in LNG import growth in 2025 will be typical for all Asian countries, except, perhaps, Japan, but the main contribution to the overall stagnation will be made by a decrease in demand in China and its stabilization in India. The decrease in China's LNG imports is offset by an increase in its own production and pipeline gas supplies from Russia via the Power of Siberia, but the general slowdown in the growth rate of gas demand in the country is also having an effect. A new phenomenon is emerging, within the framework of which the Chinese market is partially taking over the function of a balancing consumer, which was previously traditionally performed by Europe, which had the opportunity to reduce LNG imports due to the growth of supplies of Russian pipeline gas.
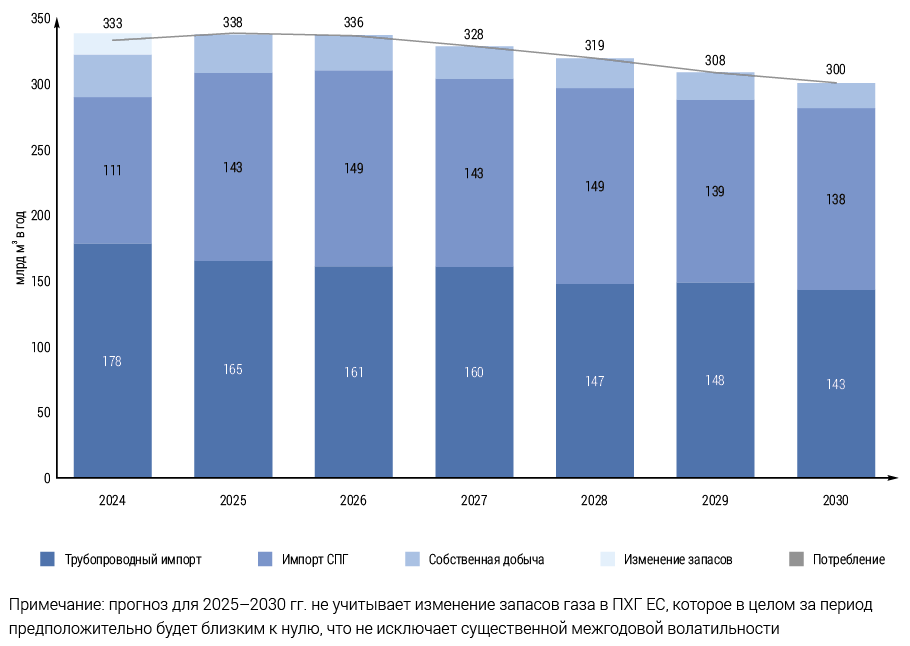
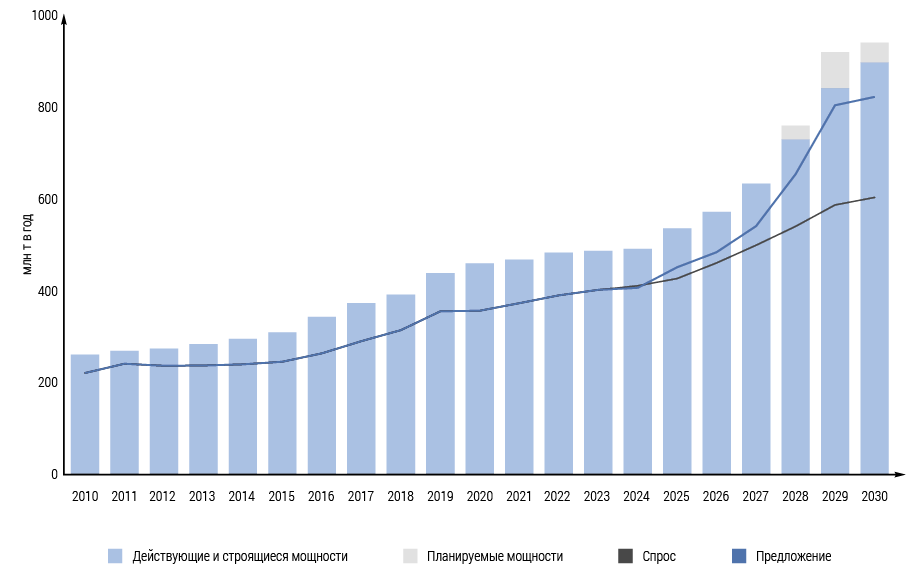
In the 2025–2030 perspective and probably, although less definitely, also in the 2030s, international LNG trade will steadily grow due to increasing demand for gas, primarily in countries that have no or limited access to alternative sources of gas supply (domestic production and pipeline imports). Demand for LNG will be supported by the expansion of gas use as a transition fuel to low-carbon energy and the low level of saturation and gasification of new markets, primarily in China, South Asia and, to some extent, Southeast Asia. Due to this, by 2030, international LNG trade, according to average estimates, may increase in the baseline scenario to 600 million tons per year, i.e. grow almost one and a half times compared to the 2024 level. The European market introduces significant uncertainty into the long-term dynamics of global LNG demand due to the EU plans to further reduce overall gas demand by 2030, as well as, although less likely, a partial restoration of Russian pipeline gas supplies in the event of a future improvement in general political and economic relations between Russia and the EU or its individual countries. However, even without a reduction in LNG imports by the EU and maintaining them at a high level until 2030, the global LNG market will face, according to our estimates, a multi-year period of excess supply. On an annual level, it will begin in 2026 (on a monthly level, possibly by the end of 2025) and will last until 2028–2029. The reason for the supply surplus will be the excess (outstripping demand needs) increase in production capacity based on investment decisions made in the late 2010s – first half of the 2020s.
To eliminate the supply glut, a combination of higher demand growth rates than assumed in the baseline scenarios and a postponement of new liquefaction capacity launches will be required. The latter is indeed observed in 2024–2025, but only in isolated cases, mainly related to unexpected construction problems (e.g., the Golden Pass plant in the US) or sanction restrictions (new Russian LNG plants). However, even if the launch of new liquefaction capacity in Russia is completely stopped, the global LNG supply glut in 2026–2029 will decrease, but will not be eliminated.
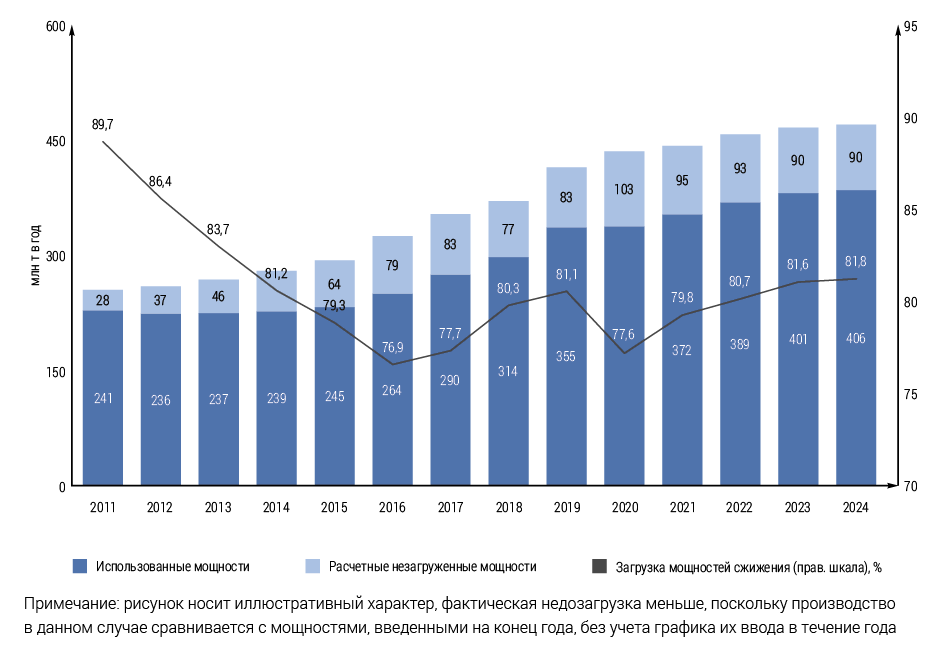
It should be noted that, given the specifics of LNG as a commodity, the formation of excess supply does not at all mean a threat of market glut. Unlike, for example, the oil and oil products market, the LNG market has limited, geographically extremely unevenly distributed and not intended for the formation of long-term reserves storage capacities. Even in the most developed market in terms of storage capacities, Japan, they primarily play the role of balancing seasonal unevenness in demand, partly compensating for the lack of UGS. In this case, glut, if it occurs, will be at the monthly/seasonal level, and will be barely noticeable in annual terms. Excess supply in the case of LNG mainly means an increase in free production capacities and, as a result, a decrease in their utilisation at individual plants and in individual countries. At the same time, the presence of free capacities in itself is a normal state, traditionally inherent in the LNG market. Formally, up to 18–20% of capacities on average remain idle for various reasons. This picture looks paradoxical against the backdrop of the LNG supply deficit felt in 2022–2025. This is explained by the fact that the actual volume of idle capacities that can be quickly brought into production is significantly smaller, since many of them cannot be used due to objective circumstances: first of all, a decrease in gas production (Indonesia, Trinidad and Tobago, Algeria, Egypt, Nigeria, etc.), and in some cases, the availability of a pipeline alternative (for example, in Algeria). As a rule, these restrictions are long-term. Since 2015, a large plant with a capacity of 7.2 million tons per year has been idle due to the armed conflict in Yemen, and its return to operation is unlikely. In addition, one should take into account the seasonal unevenness of LNG production and exports, scheduled maintenance and unscheduled shutdowns, as well as the availability of freight. The real opportunity to quickly load underutilized capacities is mainly possessed by the United States.
Full plant utilisation (at a level of around 100% of design capacity) is typical mainly for the Middle East countries, and until 2024 (before the commissioning of Arctic LNG 2) was also typical for Russia. Relatively high utilisation remains in Australia and the USA.
The emerging excess supply is not accidental. It is based on the almost simultaneous, uncoordinated and unrelated to the dynamics of demand increase in supply in three of the four (excluding Australia) key LNG producing countries (the US, Qatar and Russia), as well as the gradual entry into the market of a number of new exporting countries. In many ways, the situation in 2025–2029 resembles the market dynamics of 2016–2019, with the difference that then the main growth in supply was provided by Australia, and now by the US, and Qatar did not participate in the fight for production growth at that time, and now Australia is almost not participating.
The overall strategic vision of both the Big Four and, obviously, other producers is that they will be able to squeeze out competitors, including winning the global cost competition. This confidence is superimposed by the organizational peculiarity of the key market in terms of capacity growth, the United States. Unlike most other LNG exporting countries, the United States is known to lack centralized planning and management of new LNG plants, and gas production and supply, LNG production and export are organizationally separate. This ensures rapid, but partly chaotic, growth of LNG production in the United States. One of the key consequences of excess supply should be a decrease in spot prices for gas in Europe and Asia. In the domestic US market, the price reaction will probably be the opposite due to the competition of LNG plants with domestic gas consumption. Additional pressure on gas prices will also come from the expected further decline in global oil prices in 2025–2026, which continue to determine the cost of LNG in many long-term contracts. The level to which spot LNG prices may fall in 2026–2028 can only be speculated upon at this point – gas prices have been extremely volatile since 2019. Prices will likely remain relatively high, at around $250–300 per thousand cubic meters, due to the weak alternative to pipeline imports in Europe and the overall increase in costs. However, even in this case, some liquefaction capacity (in Australia, the US, etc.) may be at the break-even point. In the US, the effect of declining export prices may be amplified by rising domestic gas prices, which will further reduce export margins.
But in the global LNG market, production, unlike consumption, historically has shown little or no response to current price dynamics. This is due to a number of additional influencing factors, including the model of price risk distribution between the plant, traders and LNG buyers (primarily in the US), the financial stability of plant owners and their long-term strategy, the use of price hedging, and government policy, the role of which can be considered decisive for most countries, with the exception of the US and Australia.
The full stop of the LNG production plant has high expenses to restore production in the future. Preservation of production on one of the lines allows maintaining the internal temperature of the main cryogenic heat exchanger, which is an important technological restriction. Thus, manufacturers are likely to follow the path to reducing the overall load of production lines, or in extreme cases - temporary conservation of individual LNG lines. The restoration of production on closed lines is associated, according to IEFs, with relatively small costs and requires an average of 9 to 15 weeks to return to production. The general general assumption is a low sensitivity of LNG production at the current plants to the level of gas prices, provided that manufacturers and suppliers are confident in the postponed long -term price increase. At the same time, production can shortly decrease in the absence of sufficient demand - it is precisely the possibility of sales, and not price conditions will determine the loading of capacities.
At the same time, the likely brief and medium-term production reductions in themselves may not become a significant factor for the dynamics of spotal gas prices in Europe and North-East Asia. From the point of view of impact on prices, the balance and supply of LNG demand is determined, first of all, the ratio of demand and the total volume of liquefaction capacities (regardless of the level of their current load), provided by the resource base and transport infrastructure. In this regard, the cost of the value, according to our assessment, is exerted by the non -current liquefaction capacities, but the shift of the deadlines or the refusal of the construction of those new capacities by which investment decisions or decisions for which can be changed. The “low -carbon” positioning of LNG can be a new factor of competition, primarily by using various offices. But so far it is unlikely that this direction will have time to get wide development until 2030.
In general, the weak brief and medium-term sensitivity of export-oriented production of LNG to price dynamics is a significant problem in terms of timely balancing demand, supply and prices in the global LNG market. The long -term periods of the deficiency and surplus of the proposal formed in this way, in turn, cause, in our assumption, the delayed negative effect in the form of untimely investment decisions made, which triggers a new round of future imbalance and demand. A similar picture of the market will be characterized by the second half of the 2020s.
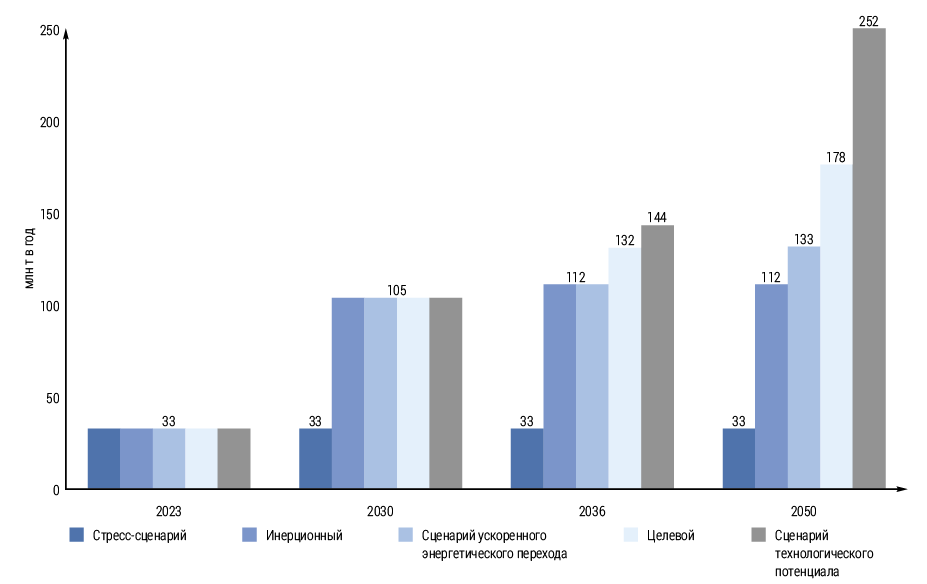
Russia, along with the United States, has the highest potential for long -term growth in LNG proposal. In 2025, this was a vivid reflection in the targeted and forecast indicators of the Russian energy strategy for the period until 2050. The objects of exported-oriented large-fiber production of LNG stated in it is difficult to name differently as ambitious, especially in the conditions of unprecedented sanctions pressure exerted on the Russian LNG, starting from the fall of 2023. The established threat of the formation of the formation Excess supply in the global LNG market in the second half of the 2020s. Creates adverse price and sales conditions for the development of new LNG projects. Also, in the context of the expected excess of US offers as a key long -term competitor of Russia in the world LNG market, there will be economic incentives for the further use of non -market, sanctions mechanisms to reduce the supply of liquefied gas from Russia. And the EU countries will receive by 2027–2028. The ability to partially or completely abandon the import of Russian pipeline and liquefied gas, replacing it with the supply of LNG from the United States and the countries of the Middle East.
But at the same time, this excess can lead to a sharp slowdown in the world of new investment decisions in relation to planned LNGs with the commissioning of commissioning after 2028, which should contribute to the balancing of the global LNG market in the first half of the 2030s.
energypolicy


